The Hertzsprung-Russell
Diagram
![]()
| At first glance, the relationship of stellar luminosity, temperature, size and spectral class seems random. In 1911, Danish astronomer Ejnar Hertzsprung showed that a regular pattern appears in a plot of stellar luminosity versus temperature. In 1913, Henry Norris Russell independently discovered a virtually identical pattern when he plotted stellar luminosity versus spectral class. The plot is now known as the Hertzsprung-Russell (H-R) diagram to honor the two astronomers. | ||
|
|
||
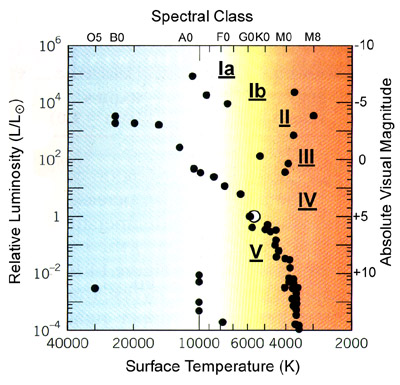
| Figure 1. A Limited Hertzsprung-Russell Diagram. (Adapted from Zeilik, Astronomy: The Evolving Universe, 8th Ed., Wiley, 1997.) | ||
| Figure 1 shows a typical H-R diagram. The most striking feature of the H-R diagram is that data points (stars) are not scattered randomly over the entire plot but are grouped into fairly well defined regions. The diagonal band of stars from upper-left to lower-right is known as the main sequence. Stars in the upper-right region of the H-R diagram are red giants and red super giants (because they visually appear red) and the stars in the lower left are the white dwarfs (core remnants, about the size of the Earth, from dead stars). Even though the red giants are cool, they radiate nearly as bright as the main-sequence blue giants (upper left) so they must have large stellar radii. In fact, they do - red giants may be 10 to over 100 times larger than our sun and may be 100-1000 times more luminous. The red super giants are even larger with radii 1000 or more times our sun!
|
||

|
|
||
| Figure 2. The H-R diagram with the regions of the stellar luminosity subclasses identified | ||
| Stars on the H-R diagram group in 6 generally well-defined regions which have been classified into the 6 luminosity classes. |
||
|
Luminosity |
Characteristic |
|
|
|
| Ia | Most luminous supergiants |
| Ib | Less luminous supergiants |
| II | Luminous giants |
| III | Normal giants |
| IV | Subgiants |
| V | Main sequence stars |
|
|
|